Data
Every source that matters, in one view you can act on
Social, search, shelf, science and spend, from every corner of every market, fused with your own data, frameworks and segments. Others pick a lens. We take the whole picture.
- Source families
- 9
- Source types
- 54+
- Regions
- 5
- Views to act on
- 1
Sources
If it carries a signal, we’re reading it.
Most providers see the market through one or two lenses. We read them all at once: the conversations, the searches, the shelves, the science and the money. We catch a signal wherever it surfaces first, then test it against everything else.
Social & culture
- Social listening across every major platform
- TikTok, Instagram, YouTube & short-form video
- Reddit, forums & niche communities
- Creators & influencer content
- Podcasts, music & streaming culture
- Gaming communities
Search & intent
- Search demand & rising queries
- Marketplace & retailer search
- App store rankings & reviews
- Website & traffic trends
- Q&A and “how to” behaviour
- Voice & AI-assistant questions
Commerce & shelf
- E-commerce listings & ratings
- Product reviews at scale
- Pricing, promotion & availability
- New product launches
- Retail sales & scan data
- Menus, recipes & food service
Media & advertising
- News & trade press
- Ad libraries & creative tracking
- Brand mentions & share of voice
- Sentiment & reputation
- Events, launches & campaigns
- Fashion, design & trend forecasting
Science & innovation
- Patents & IP filings
- Academic & clinical research
- Ingredients, materials & formulations
- Start-ups & venture funding
- Technology adoption curves
- Regulatory & standards changes
Economy & society
- Macroeconomic & consumer confidence
- Demographics & census
- Jobs, hiring & skills data
- Company filings & earnings calls
- Trade, supply chain & mobility
- Climate, weather & seasonality
Research & panels
- Surveys & brand trackers
- Consumer & shopper panels
- Qualitative & ethnographic studies
- Syndicated market reports
- Expert & analyst views
- Usage & attitude studies
Your own data
- CRM & first-party customer data
- Sales, sell-out & distribution
- Customer service & feedback
- Past research & insight libraries
- Brand frameworks & segmentations
- Campaign & media performance
And everything else
- Partner & licensed datasets
- Category-specific sources
- Local-language sources in every market
- Structured & unstructured data
- Text, image, audio & video
- New sources as they emerge
If a source holds a signal that matters to your question, we cover it. If it isn’t on the list yet, it will be.
Source families read on every question
Social, search, shelf, science, spend and more, read together.
Typical provider scope based on our review of the market.
View as table
| Source families | |
|---|---|
| Griffin Group | 9 |
| Typical data platform | 1–2 |
| Traditional agency | 1 |
Regions
The first truly global, regionally relevant solution.
From global capitals to emerging hubs, we listen in the local language and the local context. You see a shift the moment it starts, wherever it starts, and watch it travel from one market to the next.
Competitors
One or two regions
Most platforms cover one or two regions with dragnet category data: broad, generic and blind to what makes each market different.
Traditional agencies
A handful of focus groups
Many still sell a view built on a handful of focus groups, often run over Zoom at in-person prices. Even a survey of a few thousand is a fraction of the picture.
Griffin Group
Organic and relevant, everywhere
Real, unprompted behaviour from real people, read in local context in every region.
Regions read in local language and context
From global capitals to emerging hubs.
Typical provider scope based on our review of the market.
View as table
| Regions | |
|---|---|
| Griffin Group | 5 |
| Typical data platform | 1–2 |
Why surveys alone miss the picture
In many online surveys, most responses have to be thrown out.
Upper bound seen in online survey samples. We read real, unprompted behaviour instead.
View as table
| Share of responses | % |
|---|---|
| Bots and invalid responses | 70 |
| Usable | 30 |
Without it, spotting a black swan is like archery in the dark. You might hit something, but you’ll never know what you missed.
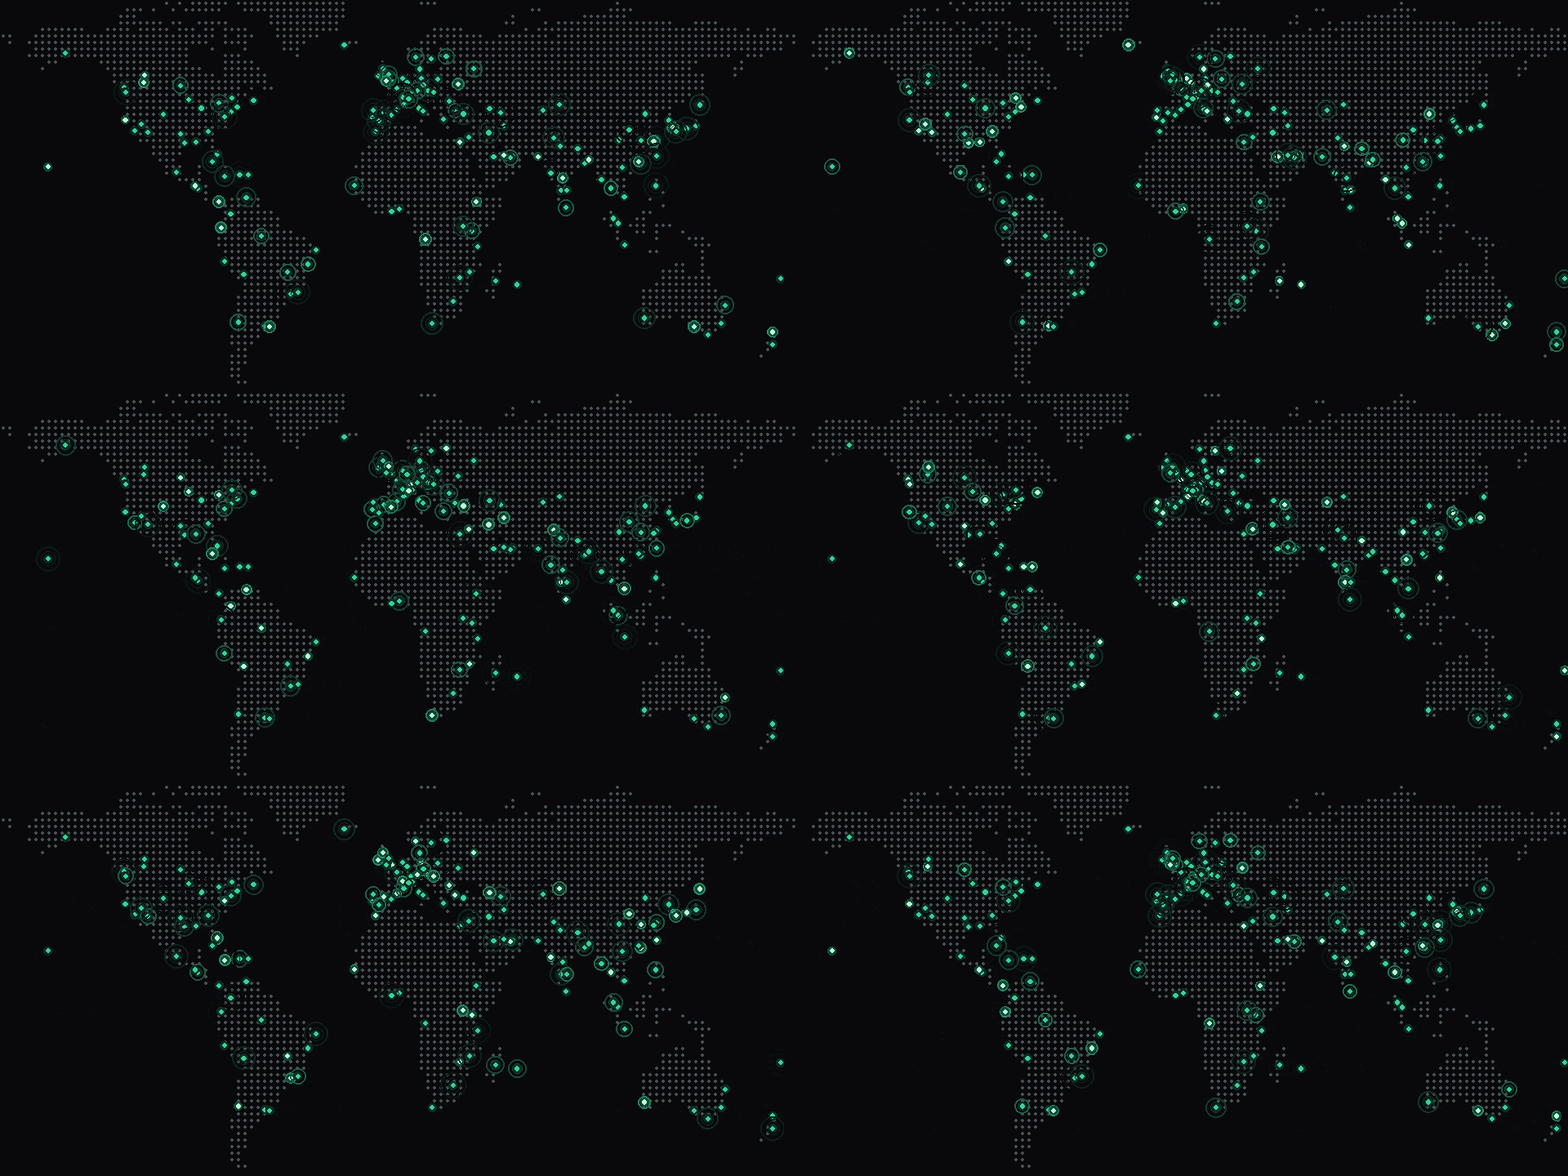
- North America
- Latin America
- Europe
- Middle East & Africa
- Asia-Pacific
Compounding Intelligence
Your data. Your frameworks. Our signals. One view.
We securely bring in your own data, along with the frameworks and segments your teams already use, and fuse it with everything above. Messy, partial or pristine, every input is cleaned, weighted and mapped into a single view. Each new input sharpens the picture, so your intelligence compounds instead of gathering dust in silos.
Secure by design
Your data comes in through encrypted, permissioned connections, kept separate and used only for your work.
Your frameworks & segments
We work inside the brand models, need states and segmentations you already use, so insight lands in your language.
Any quality, one standard
Clean, partial or messy, every dataset is harmonised and quality-scored, so stronger evidence carries more weight.
Intelligence that compounds
Every new source and study builds on the last. The view gets sharper every time you use it.
Every input sharpens the view
Confidence in a signal as more independent sources confirm it.
Illustrative. Confidence scoring varies by question and category.
View as table
| Inputs | Confidence (0–100) |
|---|---|
| 1 source | 35 |
| 3 sources | 58 |
| 5 sources | 74 |
| 7 sources | 86 |
| 9 + your data | 95 |
See what your data could show you
Bring us the question keeping you up at night and the data you already have. We’ll show you the whole picture.